Please enter some preliminary information

1/15

What is your name?

Where are you from?(nearest city or town)

What sector of the economy are you involved in?

What is the most significant drought related impact that you have experienced?

Gridded Temperature

2/15

temperatureDownload file for Google Earth:monthly_temperature_anomaly.kmz

Description:
This mean monthly temperature data is a result of a quality controlling and gridding procedure. The result is a dataset of temperature at a 10km resolution. It is unique in its interpolation technique by taking into account elevation effects using the SPLINE methodology. The data is presented as an anomaly; the difference between the observed monthly temperature in regards to the long term average.

Provide an example of how you would use this information?

For what time would this information be most valuable?

If available as a forecast, when would this information be the most valuable?

What time scale would be most valuable?

What percentage of the time would this information need to be correct to be useful?

What spatial scale would be most valuable?


Additional comments on this data product?

Gridded Precipitation

3/15

precipitationDownload file for Google Earth:monthly_precipitation_anomaly.kmz

Description:
This mean monthly precipitation data is a result of a quality controlling and gridding procedure. The result is a dataset of precipitation at a 10km resolution. It is unique in its interpolation technique by taking into account elevation effects using the SPLINE methodology. The data is presented as an anomaly; the difference between the observed monthly precipitation in regards to the long term average.

Provide an example of how you would use this information?

For what time would this information be most valuable?

If available as a forecast, when would this information be the most valuable?

What time scale would be most valuable?

What percentage of the time would this information need to be correct to be useful?

What spatial scale would be most valuable?


Additional comments on this data product?

Groundwater Levels

6/15

GroundwaterDownload file for Google Earth:groundwater.kmz

Description:
The groundwater levels for AB and SK are represented by selected shallow aquifer observation wells which reflect local climate variability. The measured groundwater levels at these locations are considered point measurements and are representative of the local conditions. The measurements should not be extrapolated due to the inconsistent nature of aquifers and soil properties across the region. The information presented is the water table as the percent rank of the record. In other words on a scale of 0 to 100 the level of the water table is ranked in regards to other observations on record. A 10 percent rank means that the level of the groundwater table has only been at this level or lower 10 percent of the time and can be considered to be a near record low. A value of 50 percent is considered normal and 90 percent is considered to be a near record high water table.

Provide an example of how you would use this information?

For what time would this information be most valuable?

If available as a forecast, when would this information be the most valuable?

What time scale would be most valuable?

What percentage of the time would this information need to be correct to be useful?

What spatial scale would be most valuable?


Additional comments on this data product?

Spring Pond Count

5/15

Pond CountDownload file for Google Earth:pondcount.kmz

Description:
This information describes the number of ponds present in the prairies after the spring melt. Ponds include wetlands, sloughs, water on fields and in ditches. The number of ponds represents an integrated measure of runoff generation, the size of the spring snow pack as well as antecedent (or prior) soil moisture and wetland conditions. The pond counts are collected by the USFWS and CWS flying on transects and then estimated for each of the stratums. This data has been collected yearly in May since the 1950’s for wildlife habitat assessments and is ongoing. The data presented is the estimated pond count for 2002 of each stratum (region) as a percentage of the average (1950's to 2008) number of ponds.

Provide an example of how you would use this information?

For what time would this information be most valuable?

If available as a forecast, when would this information be the most valuable?

What time scale would be most valuable?

What percentage of the time would this information need to be correct to be useful?

What spatial scale would be most valuable?


Additional comments on this data product?

Snow Water Equivalent

4/15

Snow Water Equivalent

Description:
Snow Water Equivalent is the measure of the water equivalent depth of a snow pack. For example a fresh snowfall of 10cm is the equivalent of 1cm of rain. The SWE anomaly is presented as the measured SWE in terms of the calculated standard deviation for that grid. In other words a value of -1.5 is an extremely low SWE, -1.5 to -0.5 is below average SWE, -0.5 to 0.5 is near normal SWE, 0.5 to 1.5 is above average SWE and 1.5 is an extremely high SWE.

Provide an example of how you would use this information?

For what time would this information be most valuable?

If available as a forecast, when would this information be the most valuable?

What time scale would be most valuable?

What percentage of the time would this information need to be correct to be useful?

What spatial scale would be most valuable?


Additional comments on this data product?

Palmer Drought Severity Index

7/15

Palmeer Drought Severity IndexDownload file for Google Earth:pdsi.kmz

Description:
PDSI is a drought index that measures dryness using a supply and demand model for soil moisture. It is an approximation based on a calculation using recent temperature and precipitation data. It is designed to characterise relative drought severity over a similar region. The numbers can be interpreted as follows: minus 4 is extreme drought, minus 3 is severe drought, minus 2 is moderate drought and 0 is normal. The corresponding positive values mean the same thing for wet periods.

Provide an example of how you would use this information?

For what time would this information be most valuable?

If available as a forecast, when would this information be the most valuable?

What time scale would be most valuable?

What percentage of the time would this information need to be correct to be useful?

What spatial scale would be most valuable?


Additional comments on this data product?

Plant Available Water

8/15

Plant Available WaterDownload file for Google Earth:paw.kmz

Description:
Plant Available Water (PAW) refers to the amount of soil water in the root-zone soil column that can be extracted by a plant. The PAW (in percent) represents how much water is available for the plants to extract relative to the maximum amount of water available to a plant that can be "held" in the root zone. This value is a standardized measure though the maximum amount of PAW varies with soil texture. Typically plants can function very well if PAW is 50% or higher, between 30% and 50% the transpiration of water vapour and above ground biomass are reduced somewhat, and below 30% there is a rapid decrease in photosynthesis and above ground biomass. This is due to the plant going into survival mode and directing its resources to growing more roots. A PAW of 30% is indicative of moderate to severe drought conditions.

Provide an example of how you would use this information?

For what time would this information be most valuable?

If available as a forecast, when would this information be the most valuable?

What time scale would be most valuable?

What percentage of the time would this information need to be correct to be useful?

What spatial scale would be most valuable?


Additional comments on this data product?

Soil Moisture Anomaly Percentage Index

9/15

Soil Moisture Anomaly Percentage IndexDownload file for Google Earth:smapi.kmz
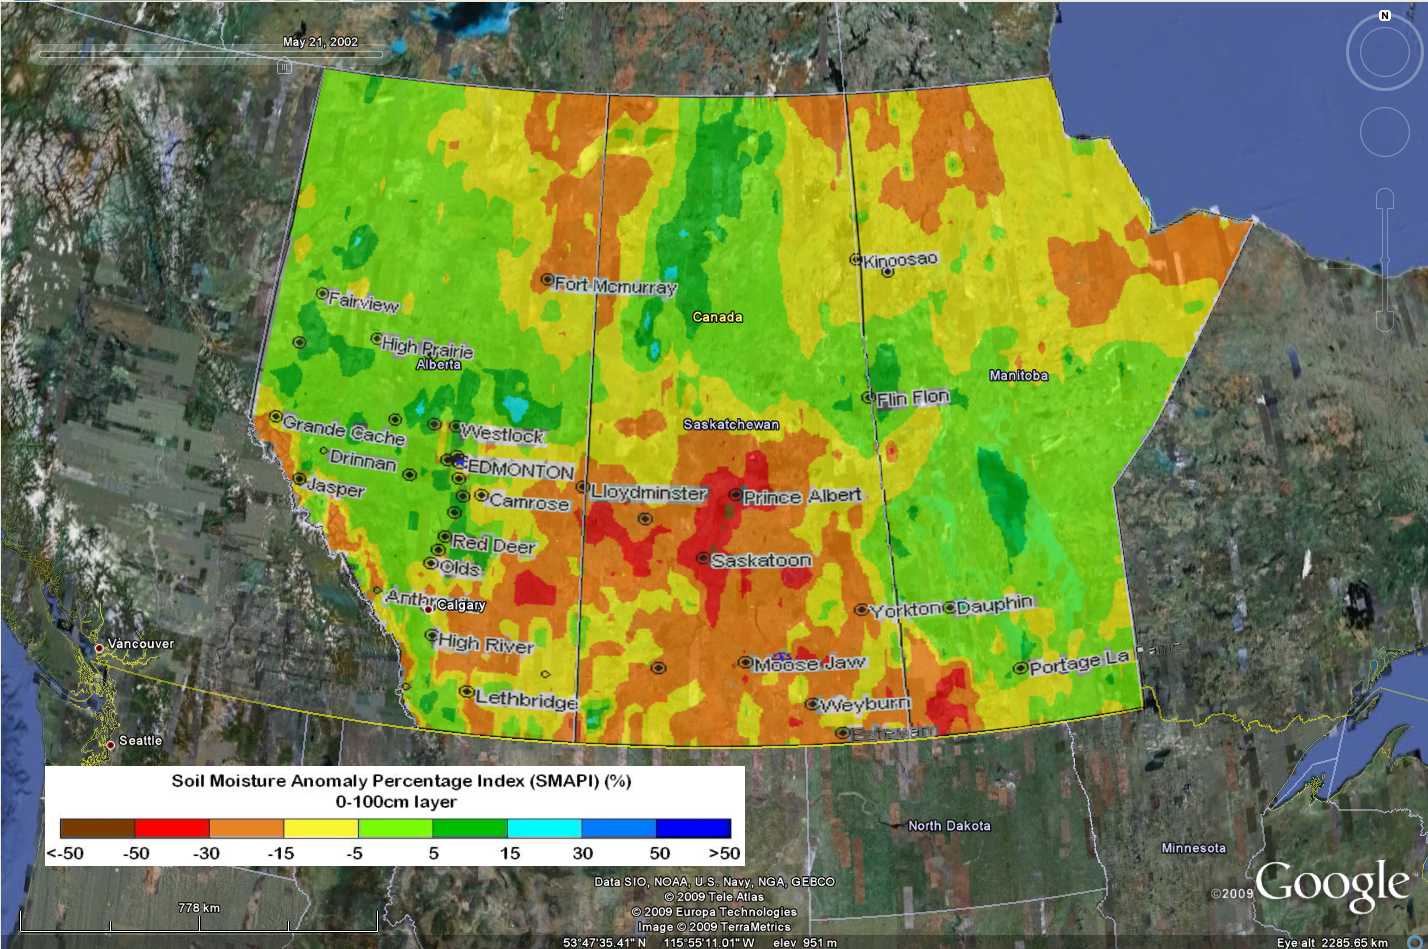
Description:
Using observed temperature and precipitation measurements soil moisture is calculated using the Variable Infiltration Capacity Model. This model accounts for non contributing areas characteristic of prairie hydrology. The soil moisture has been calculated for 1950 to present and this record reflects local characteristics and mirrors the hydro-meteorological phenomena of the prairies. The model output is available for 3 soil layers: 0-20cm depth, 20-100cm depth and 0-100cm depth. It has been calculated on a daily, monthly, seasonal and annual timescale historically. It is available in real time with a forecast period of up to 1 month. The map is shown in units of SMAPI. SMAPI compares the calculated soil moisture to the average soil moisture (1950-2005) and presents it as a percentage. In other words, a value of -30% means that the calculated soil moisture is 30% less than average. To provide context -50 refers to extreme drought, -50 to -30 to severe drought, -30 to -15 to moderate drought, -15 to -5 to mild drought and -5 to 5 to near normal conditions. The same naming convention can be applied to the positive numbers though in terms of wetness.

Provide an example of how you would use this information?

For what time would this information be most valuable?

If available as a forecast, when would this information be the most valuable?

What time scale would be most valuable?

What percentage of the time would this information need to be correct to be useful?

What spatial scale would be most valuable?


Additional comments on this data product?

Simulated SWE and Spring Freshet

10/15

Cold Regions Hydrologic Model

Description:
These simulations are made with the Cold Regions Hydrologic Model (CRHM) which models all significant hydrological processes on a hypothetical well-drained catchment composed of fallow and stubble fields and a grass coulee. It is a product of five decades of hydrologic research at the University of Saskatchewan. In this simulation it has been run with data from Winnipeg, Manitoba.
SWE time series: This is the seasonal progression of SWE over the whole catchment (cropped and grass) for 2002 compared to the normal period (1960-90). It shows the effects of mid winter melts and snow redistribution.
Maximum SWE: This is the modelled seasonal maximum SWE after snow redistribution and mid-winter melts for the same hypothetical well drained basin with cropped and grass surfaces. Years shown are 2002 and the 30 year normal (1960-90).
Spring Freshet: This is the amount of spring runoff from the whole catchment for 2002 compared to the normal period (1960-90). The actual conditions for 2002 may be lower than this due to assumptions made in this provisional run of the model.

Provide an example of how you would use this information?

For what time would this information be most valuable?

If available as a forecast, when would this information be the most valuable?

What time scale would be most valuable?

What percentage of the time would this information need to be correct to be useful?

What spatial scale would be most valuable?


Additional comments on this data product?

Monthly Temperature Anomaly Forecast

11/15

May Temperature ForecastDownload file for Google Earth:monthly_temperature_forecast.kmz

Description:
The following forecast is a product of the Historical Forecast Project 2 (HFP2). This project uses similar data inputs and climate models as present forecasts to generate forecasts of various variables and time periods for the past. Currently at these large time scales the forecasts have more skill in predicting variables in the winter and early spring months. These forecasts have more skill in terms of temperature rather than precipitation. Temporally these predictions are made on the day prior to the period that is forecasted. So a May forecast would have been produced and released on April 30. This map is the mean forecasted temperature for May in relation to the mean observed temperature in that region.

Provide an example of how you would use this information?

For what time would this information be most valuable?

If available as a forecast, when would this information be the most valuable?

What time scale would be most valuable?

What percentage of the time would this information need to be correct to be useful?

What spatial scale would be most valuable?


Additional comments on this data product?

Monthly Precipitation Anomaly Forecast

12/15

May Precipitation ForecastDownload file for Google Earth:monthly_precipitation_forecast.kmz

Description:
The following forecast is a product of the Historical Forecast Project 2 (HFP2). This project uses similar data inputs and climate models as present forecasts to generate forecasts of various variables and time periods for the past. Currently at these large time scales the forecasts have more skill in predicting variables in the winter and early spring months. These forecasts have more skill in terms of temperature rather than precipitation. Temporally these predictions are made on the day prior to the period that is forecasted. So a May forecast would have been produced and released on April 30. This map is the mean forecasted precipitation for May in relation to the mean observed precipitation in that region.

Provide an example of how you would use this information?

For what time would this information be most valuable?

If available as a forecast, when would this information be the most valuable?

What time scale would be most valuable?

What percentage of the time would this information need to be correct to be useful?

What spatial scale would be most valuable?


Additional comments on this data product?

June, July and August Temperature Anomaly Forecast

13/15

June July August Temperature ForecastDownload file for Google Earth:seasonal_temperature_forecast.kmz

Description:
The following forecast is a product of the Historical Forecast Project 2 (HFP2). This project uses similar data inputs and climate models as present forecasts to generate forecasts of various variables and time periods for the past. Currently at these large time scales the forecasts have more skill in predicting variables in the winter and early spring months. These forecasts have more skill in terms of temperature rather than precipitation. Temporally these predictions are made on the day prior to the period that is forecasted. So a June July August forecast would have been produced and released on May 30. This map is the mean forecasted temperature for the summer in relation to the mean observed temperature in that region.

Provide an example of how you would use this information?

For what time would this information be most valuable?

If available as a forecast, when would this information be the most valuable?

What time scale would be most valuable?

What percentage of the time would this information need to be correct to be useful?

What spatial scale would be most valuable?


Additional comments on this data product?

June, July and August Precipitation Anomaly Forecast

14/15

June July August Precipitation ForecastDownload file for Google Earth:seasonal_precipitation_forecast.kmz

Description:
The following forecast is a product of the Historical Forecast Project 2 (HFP2). This project uses similar data inputs and climate models as present forecasts to generate forecasts of various variables and time periods for the past. Currently at these large time scales the forecasts have more skill in predicting variables in the winter and early spring months. These forecasts have more skill in terms of temperature rather than precipitation. Temporally these predictions are made on the day prior to the period that is forecasted. So a June July August forecast would have been produced and released on May 30. This map is the mean forecasted precipitation for the summer in relation to the mean observed preciptiation in that region.

Provide an example of how you would use this information?

For what time would this information be most valuable?

If available as a forecast, when would this information be the most valuable?

What time scale would be most valuable?

What percentage of the time would this information need to be correct to be useful?

What spatial scale would be most valuable?


Additional comments on this data product?

Additional Information

15/15

What information would you liked to have seen but is not readily available?

What information is most crucial for you to make effective decisions about drought?